The Northwood Group

Building Partner Investors

Uncategorized


Just Sold – Layton Medical

September 11, 2017

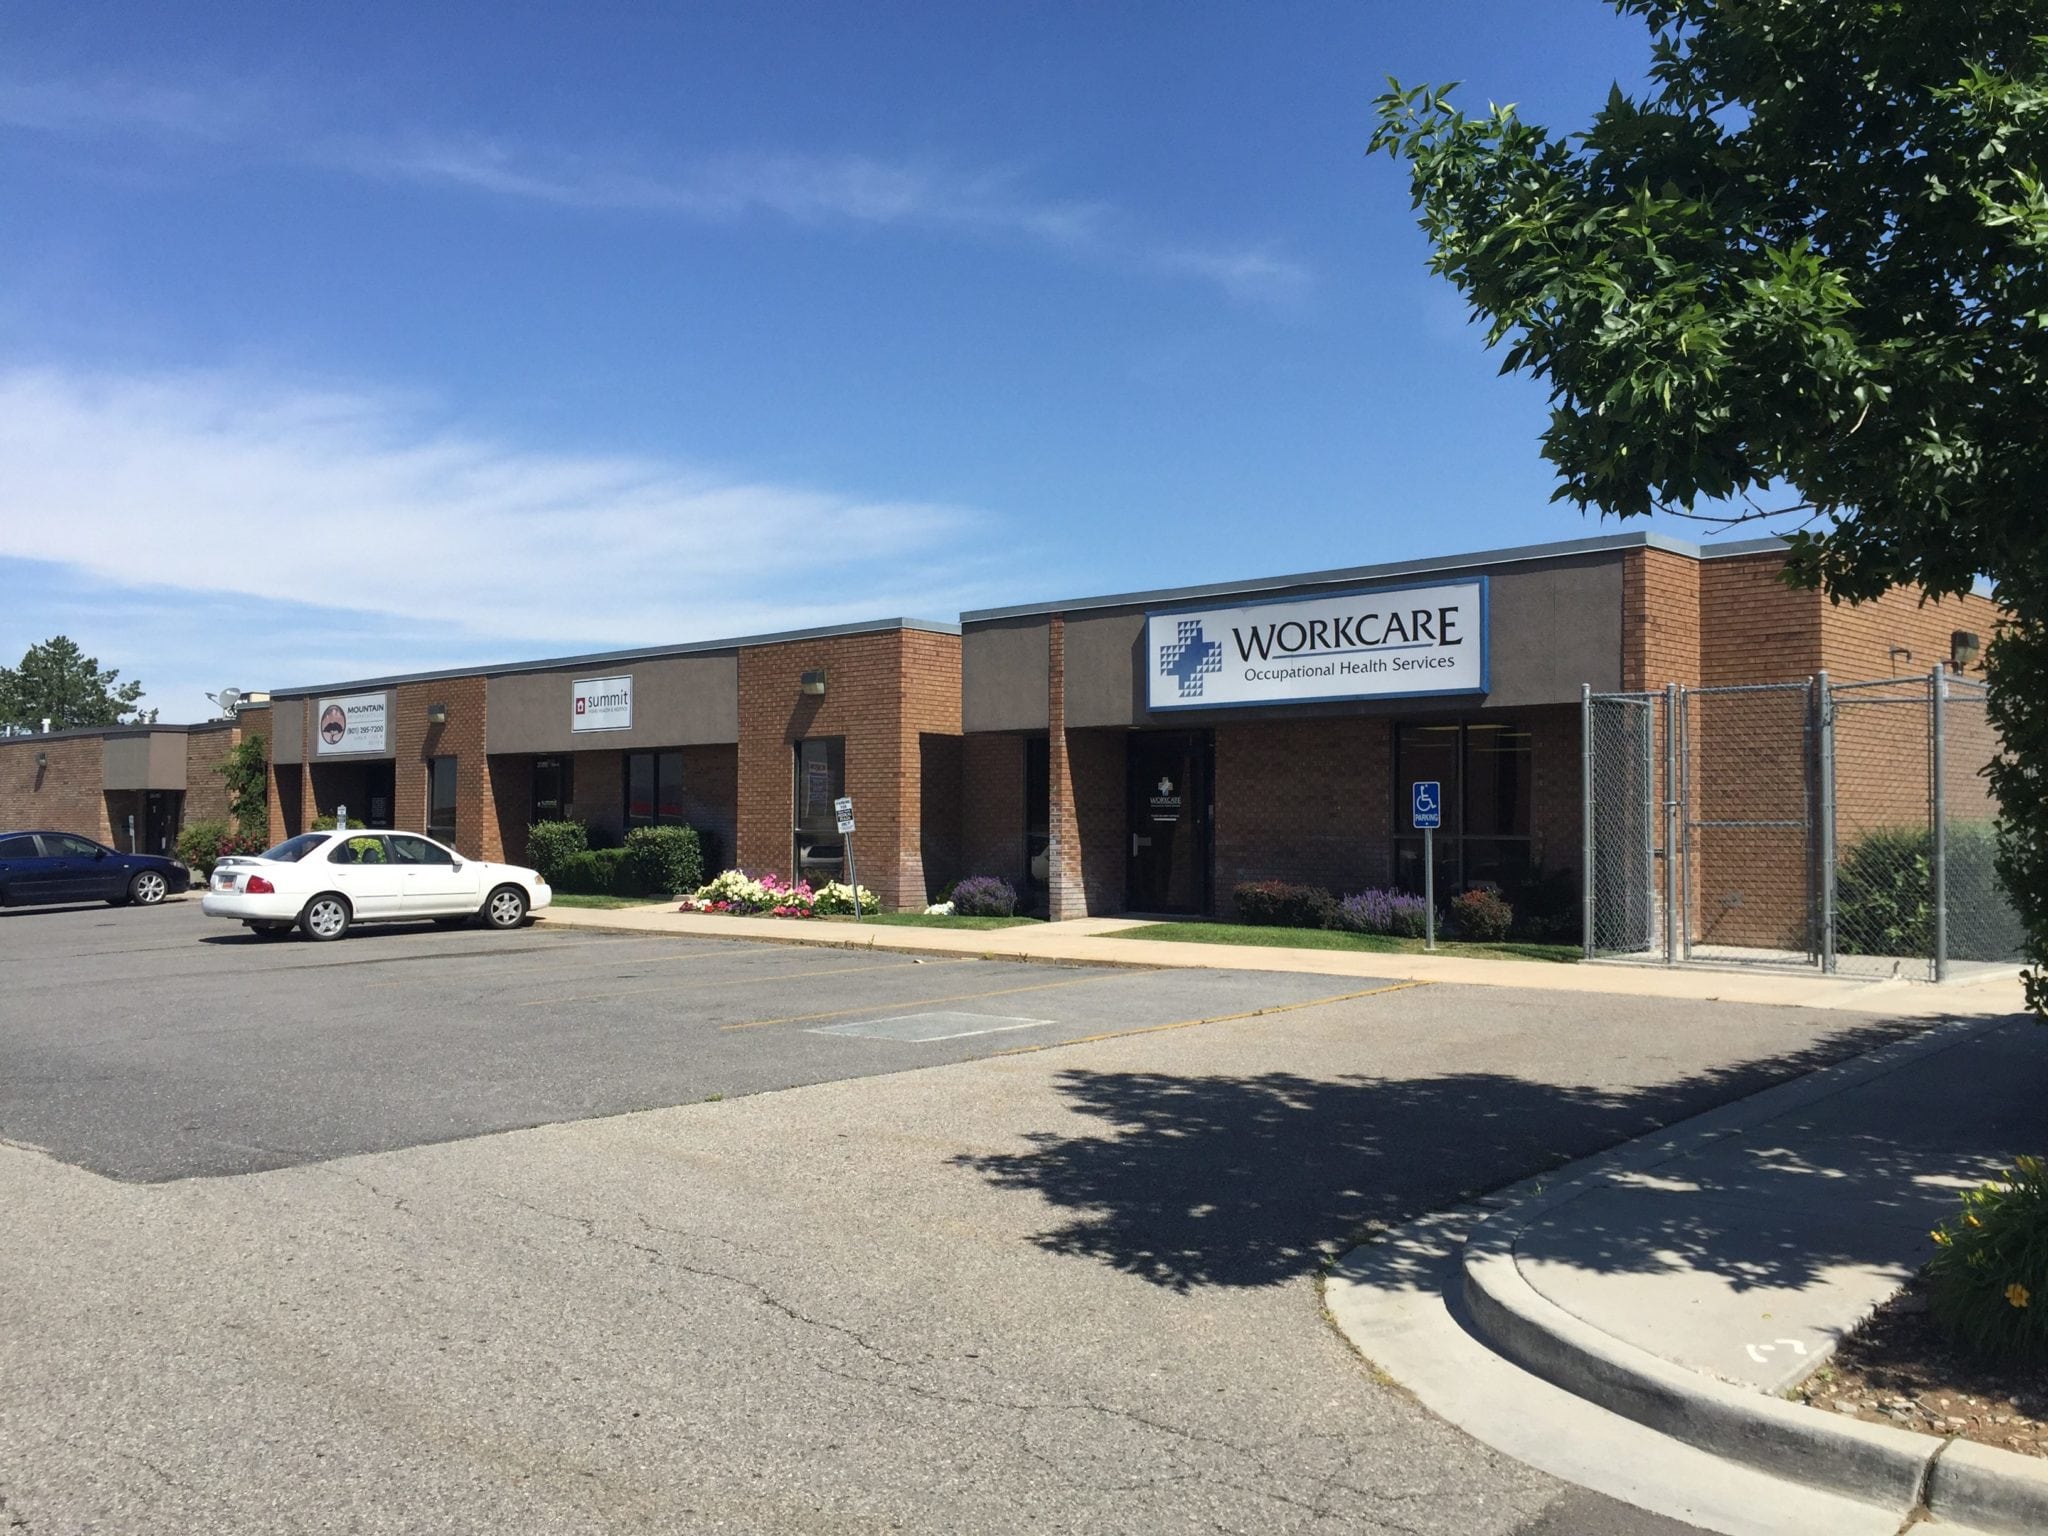
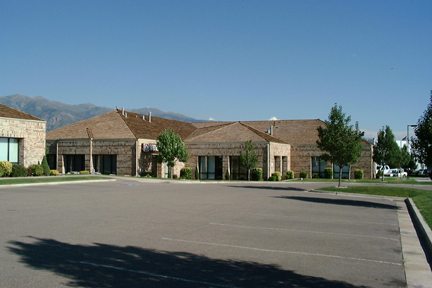
We are proud to announce the sale of the Layton Medical Building a Multi- Tenant office building located at 2086 North 1700 West in Layton, Utah on the campus of Davis Hospital. This property consists of approximately 8,641 square feet of medical office space.

Please contact us for more detailed information or for info on commercial real estate in Utah.

Read More

Just Sold – Prows Office Buildings

September 11, 2017

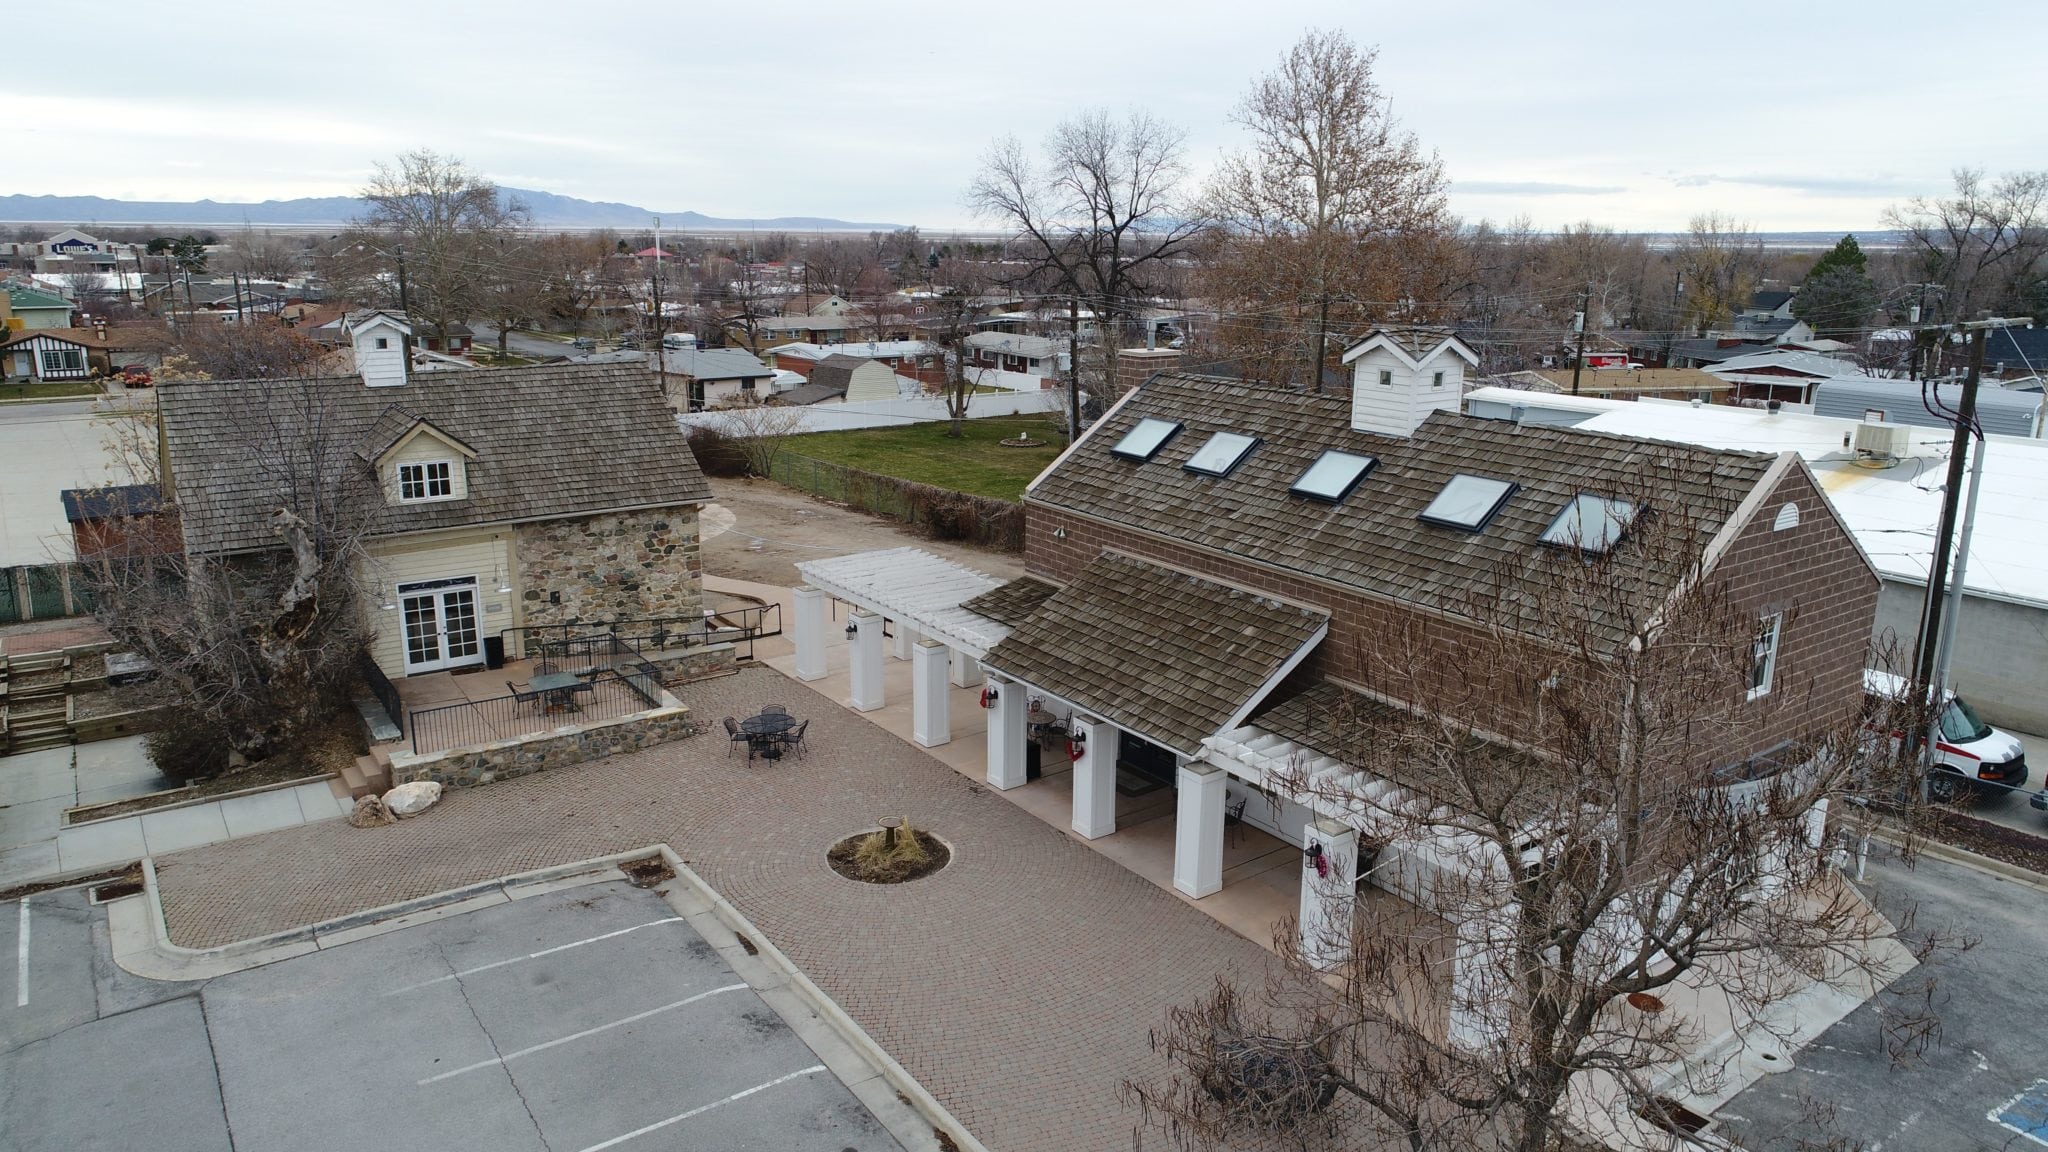
We are pleased to announce the sale of the Prows Office Buildings located at 299 North 200 West, Bountiful, Utah. The two buildings have approximately 6,824 square feet total, sitting on 0.72 acres. More information regarding this sale is available upon request.

Read More

Just Sold – South Ogden Office Investment

September 11, 2017

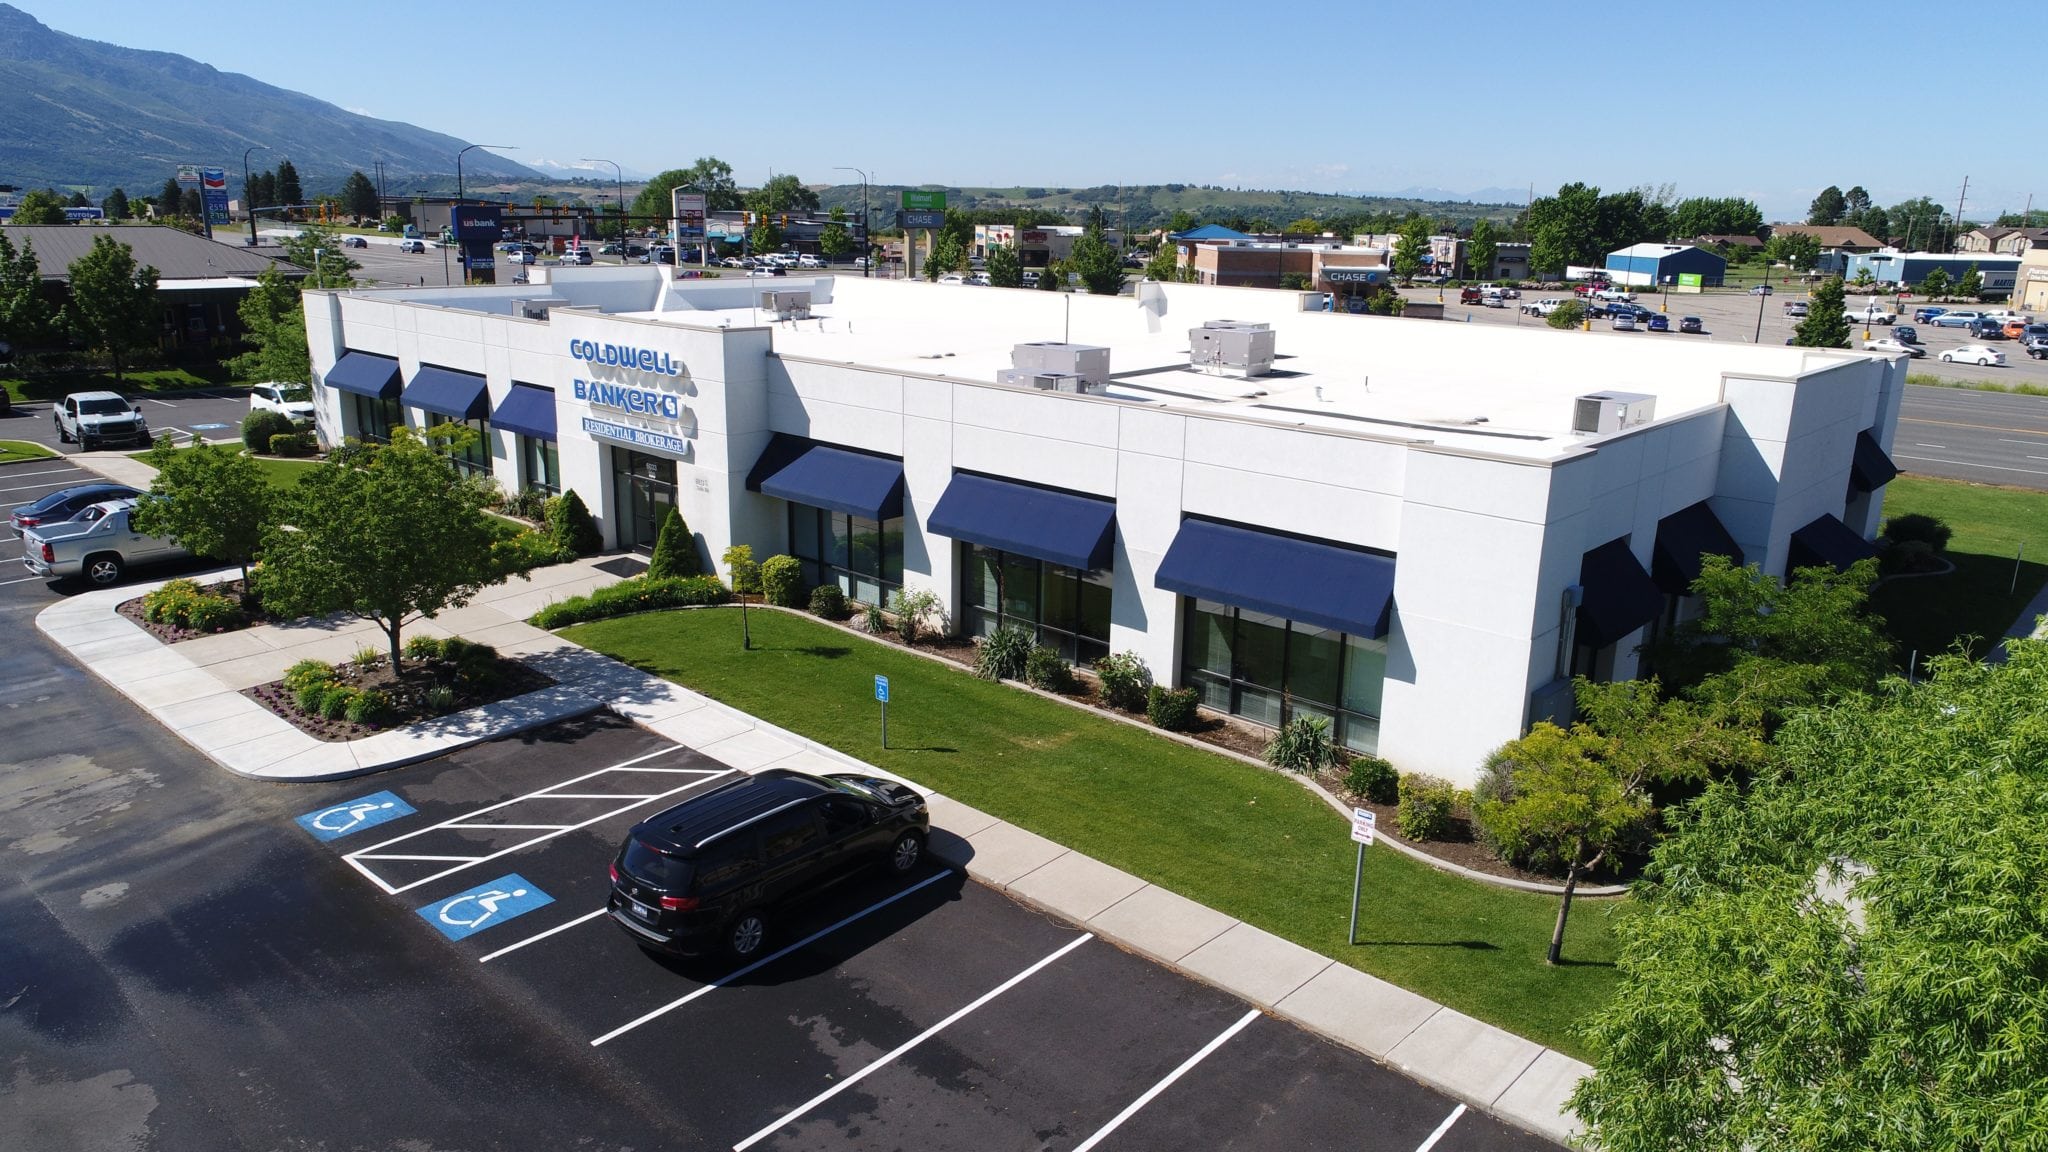
We are proud the announce the sale of the South Ogden Coldwell Banker building located at 6033 Fashion Point Blvd, South Ogden Utah. The property consists of a 13,124 square foot building sitting on 1.61 acres close access to Highway 89. Please contact us for more detailed information or for info on commercial real estate in Utah.

Read More

Just Sold – Riley Court Apartments

September 11, 2017

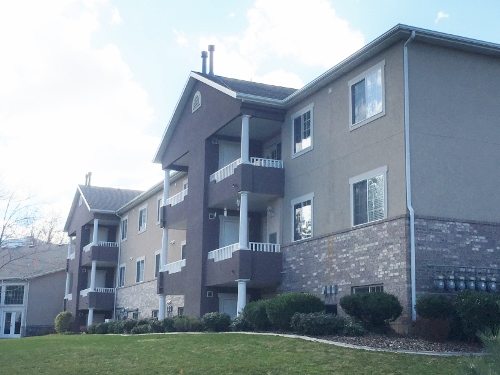
We are pleased to announce the sale of the Riley Court  Apartments located 517 South 100 East, Bountiful, Utah. The project is a 70 unit independent living project.  More information regarding this industrial building sale is available upon request.

Read More

Just Sold – Layton Kier

May 18, 2017

We are pleased to announce the sale of Kier Warehouse located 928 East Highway 193 Layton, Utah. The building is approximately 9,921 square feet and sits on 3.04 acres. More information regarding this industrial building sale is available upon request.

Read More

Just Sold – Woodland Park

March 2, 2017

We are pleased to announce the sale of The Woodland Park office complex located at 1528 North Woodland Park Drive in Layton, Utah. The project consists of approximately 45,468 square feet of office space in four buildings.   More information regarding this sale is available upon request.

Read More

ULI/McCoy Symposium on Real Estate Finance: Facing Uncertainty

March 1, 2017

I recently read an article from Urban Land Magazine written by Bendix Anderson on sixty real estate leaders coming together for the 23rd annual ULI/McCoy Symposium on Real Estate Finance, in New York City.

The invited executives that attended were high-level decision makers from major real estate investment and capital markets firms that invest or lend in the commercial real estate market. They also hail from Wall Street Firms.

In this article Urban land gave us insight and some key findings from ULI life trustee Bowen H. “Buzz” McCoy on the symposium event. I found it to be useful information.

The link for this article is below and the full text is in the body of this post following the link:

http://urbanland.uli.org/capital-markets/ulimccoy-symposium-real-estate-finance-facing-uncertainty/


ULI/McCoy Symposium on Real Estate Finance: Facing Uncertainty – Urban Land Magazine 

Sixty real estate leaders came together for the 23rd annual ULI/McCoy Symposium on Real Estate Finance, held in December in New York City.

Invited executives are high-level decision makers from major real estate investment and capital markets firms that are actively investing or lending in the commercial real estate market. Typically, they hail from major Wall Street firms, institutional investment management firms, real estate investment trusts (REITs), private equity firms, commercial banks, insurance companies, and leading private owner/development firms.

All comments made at the invitation-only event are strictly off the record. However, ULI life trustee Bowen H. “Buzz” McCoy shared with Urban Land some key findings and insights from the symposium.

How was the mood at the conference different this year than in previous years?

Everyone was unsettled because of the victory of president-elect Donald Trump. People are off-balance because of the continued uproar, day after day. The fundamental question is the world order and how provocative he gets with Ukraine, Belarus, Taiwan, and Mexico.

Would that affect international investment in U.S. real estate?

McCoy: There could be a de-globalization of real estate. I don’t think it would have such an adverse effect on pricing because it’s such a broad market.

Are there any short-term risks to real estate?

McCoy: It’s Donald Rumfeld’s “unknown unknowns” or a black-swan event. . . . I think that someone like Trump makes a black-swan event more likely. Trump himself is a black swan because nobody factored his victory into their projections. I also think he’s going to be highly inflationary. Increased military spending, increased entitlements, increased infrastructure. The consensus of speakers at the symposium was that inflation will rise to a rate of 3 percent or perhaps 4 percent and unemployment would fall as low as 4 percent. It is hard to find skilled labor. Wages are going up.

Is there any clear direction for real estate?

McCoy: The greatest friend and the greatest enemy of real estate is debt because real estate follows the interest-rate cycle so closely. Those interest rates are, sooner or later, going to increase. So if you are going into risky times, you want to be underleveraged, not overleveraged. And you want to finance long. All sides said that there is tremendous interest in current cash flow. Cash is king, and it all goes back to uncertainty, and Trump is a big part of it.

How will this uncertainty affect the real estate capital markets? For example, experts used to worry about more than $1 trillion in ten-year CMBS [commercial mortgage–backed securities] loans made before the crash that would expire over the next few years.

McCoy: Speakers at the symposium still mentioned the “wall of CMBS,” but with less fear and trepidation. A lot of the good properties got sold. That’s the good news. The bad news is that you don’t want to open the door and look at what is left. Also, banks and insurance companies won’t make loans with terms longer than seven years, but the loans that are maturing are ten-year loans. So there is a gap of about a third, and there is no one around to fund it. Also, what is the likely capitalization rate on the sale of a property? Somewhere between 6 and 8 percent is a normalized cap rate. We are way off from that. CMBS rollovers are also lower loan-to-value. Also, the junk markets are simply not there that were before.

Experts at the symposium also talked about the new risk-retention rules as being an imminent factor for CMBS. The people at the conference weren’t worried about it. The banks are so well capitalized—they thought risk retention could be handled by financial institutions.

How well are banks positioned to handle uncertainty?

McCoy: Commercial bank liquidity is at an all-time high—but the cost of regulation is very deleterious to community banks and small banks, and a record number of them are going under. The Comptroller of the Currency and the Federal Reserve and the Securities Exchange Commission have permanent offices in the large banks.

How is the incoming administration likely to affect these regulations—such as the Dodd-Frank financial reform act?

McCoy: People agree that the banks are safer. Banks say they are too safe. With Dodd-Frank, I don’t think that people who are sensible want a repeal. It’s like Obamacare—you tinker around the margins.

Do you see any signs of a bubble in the property markets? You mentioned that cap rates are unlikely to stay low.

McCoy: That depends what “low” is. We used to think 5 percent was low, when a regional mall sold at a 5 percent cap rate. And then some sell for 4 percent.

Do you see a possibility for a hard landing for real estate?

McCoy: It’s more individual sectors and individual cities. A couple of speakers thought that we could have a recession in a couple of years. I thought that was a little extreme. It would be a recession with higher interest rates.

If I were an investor about to buy a property, maybe some strip centers or apartment buildings, what would you advise?

McCoy: I would say borrow now, borrow long, and keep some powder dry.

But what if the only loan I can get is short-term, high-leverage debt?

McCoy: Sell as soon as you can. It’s a time bomb.

We are sailing into unpredictable waters. Real estate generally is in good shape. Keep your powder dry. Avoid overborrowing, but take advantage of still historically low interest rates. Extend maturities. Manage your debt. The next three years could bring about increased risk and turmoil. Be prepared!

Bowen H. “Buzz” McCoy, formerly responsible for the real estate financing unit at Morgan Stanley, is a ULI life trustee and president of Buzz McCoy Associates in Los Angeles. His most recent books are Living into Leadership: A Journey in Ethics (Stanford University Press, 2007) and The Dynamics of Real Estate Capital Markets: A Practitioner’s Perspective (ULI, 2006).


Read More

Commerical Real Estate’s Slow-Motion Slowdown: E-Commerce and Other Disruptors of the Seven-Year Boom

November 2, 2016

The Magazine of the Urban Land Institute recently published an article written by David Schulman on Commercial Real Estate’s continuing shift toward E- Commerce in a slow motion Seven-Year Boom.

I felt that this article provides an interesting commentary relative to the E-commerce disruption across each of the major commercial real estate  property types.

Also, it important to understand how these national and global trends relate to each individual local market whereas commercial real estate market fundamentals are very different.

The link for this article is below and the full text is in the body of this post following the link:

http://urbanland.uli.org/capital-markets/commercial-real-estates-slow-motion-slowdown-e-commerce-disruptors-7seven-year-boom/

Commercial Real Estate’s Slow-Motion Slowdown: E-Commerce and Other Disruptors of the Seven-Year Boom – Urban Land Magazine

These are heady times for commercial real estate. Fueled by cheap money, low levels of new construction (except for apartments), and modestly improving demand, commercial real estate values have more than doubled from their financial-crisis lows of 2009.

Nevertheless, prices are leveling off as investors have become concerned that the period of extraordinarily low interest rates may soon be coming to an end. In addition, job growth—the source of much real estate demand—will inevitably slow as the economy approaches full employment. At the same time, supply will pick up as more construction is completed in 2017 and 2018.

Thus, the overall environment for commercial real estate will become less favorable over the next few years. Further affecting the sector will be technological disruption from e-commerce and reduced square footage of office space per worker.

Continuing Shift toward E-Commerce

A report by Green Street Advisors shows that about 800 department stores—about 20 percent of all anchor space in U.S. malls—will likely close over the next few years, and many malls will close with them. Mall problems are not limited to the anchor department stores: in the first quarter, Simon Property Group, the largest owner of regional U.S. malls, once again reported that same-store sales for in-line shops were down on a year-over-year basis.

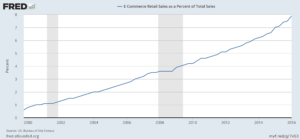
It is not that overall retail sales have been declining; to the contrary, retail sales have been increasing at a modest pace. However, a decided shift toward e-commerce has taken place. For example, in April on a year-over-year basis, department store sales declined by 1.7 percent and clothing store sales rose 1.3 percent while nonstore retail (e-commerce) surged by 10.2 percent. Indeed, since 2000 the e-commerce share of retail sales advanced from just under 1 percent to about 8 percent for the first quarter of this year.

fredgraph

However, the data understate the impact of e-commerce on retail sales: with retail sectors not amenable to e-commerce (automobiles, gasoline, food, and restaurants) removed from the calculation, the e-commerce share of sales rises to 14 percent. Moreover, e-commerce since 2000 has accounted for about 30 percent of the growth in retail sales excluding the categories cited above. For just the past five years through April, the e-commerce share of sales growth has increased to 44 percent. Indeed, it would not be surprising in the coming decade to see significant e-commerce penetration in the grocery sector, which currently is not included in the 44 percent share.           

In an effort to stay competitive, major mall operators have ramped up capital spending to make their assets more attractive to consumers, adding restaurants and experiential activities not subject to internet competition. Examples of the high level of capital spending include two competing malls in west Los Angeles—Westfield’s Century City, with an $800 million program, and Taubman’s Beverly Center, with a $500 million program.

Thus far, grocery-oriented shopping centers have been immune to the impact of e-commerce, but with Amazon moving into the private-label grocery business and attempting same-day deliveries, convenience-oriented retail may soon be disrupted as well. Indeed, the still-prized Whole Foods Market anchor is now suffering from increased competition in the organic food space.

Two years ago, it was noted that the bright spot in retail real estate was street-level retail in dense urban centers with significant tourist components. That proved true until very recently, when a strong dollar and weakness in much of the global economy diminished international tourism. As a result, asking rents are beginning to drop in Manhattan, for example, which has been a major beneficiary of luxury tourism.

Industrial: A Beneficiary of E-Commerce

What has been bad for retail real estate has been good for industrial real estate. E-commerce is warehouse intensive, and as the need to shorten delivery times has increased, the demand for close-in modern warehouses in major population centers has soared. Overall warehouse rents have been growing at a 5 percent clip. And in markets such as Los Angeles, East Bay San Francisco, and northern New Jersey, rents have increased at a double-digit pace over last year.

Office: In a Late-Cycle Recovery

After seven years of slow economic recovery, the national office vacancy rate has barely come down—from about 18 percent to 16 percent. New construction has been very sluggish until recently, and demand has been far more muted than in past cycles.

Technological disruption is obviating the need for physical file space and reference rooms, and a shift to open floor plans is reducing the square footage needed per employee. Instead of allowing for 200 square feet (19 sq m) of space per employee, planners are now allowing for 150 square feet (14 sq m). This trend is far from running its course.

One truly bright spot for office demand has been in the technology sector, including computer-systems design and related services, where 120,000 jobs were added in 2015. However, as the venture-capital tech startups wane, employment growth has slowed to 80,000 per year. This slowdown has raised worries about the sustainability of office demand in tech hubs.

Multifamily Housing: Running Out of High-Income Renters

Multifamily residential housing has seen a sustained boom since 2011. Despite a surge in new supply—starts are on track to reach 400,000 units this year—rents continue to climb much faster than the Consumer Price Index (CPI). According to official CPI data, residential rents were up 3.7 percent year-over-year in April, but because of quirks in the data, the true increase in market rents tops 4 percent—and in more than a few markets, the increase is twice that. The rise in rents is supported by a dramatic decline in the apartment vacancy rate, which of late has leveled off at a very low 4.5 percent.

A powerful factor affecting rental demand has been the long decline in homeownership. This partly reflects a preference for a more urban lifestyle and a delay in such life-cycle events as marriage and childbirth. But with the gradual rise in single-family home starts, we believe that the long decline in the homeownership rate has about run its course. Apartment owners may soon discover there might not be enough tenants to support $3,500-a-month rent for one-bedroom units. The apartment business now appears to be in transition from great to good.

Conclusion

The combination of a less favorable financial environment with weakening fundamentals arising from increased supply and reduced demand will likely bring to an end the seven-year bull market in commercial real estate. To be sure, we are in no way forecasting a crash, but rather an extended period of sideways to down prices. Simply put, financial conditions will move from being extraordinarily easy to just plain easy, making it unlikely for us to witness a repetition of the events of 2007–2009.

Read More

Understanding How Office Building Square Footage is Calculated in Utah Commercial Real Estate

September 21, 2016

I recently read an article written by Mike Chappell in the September 9th issue of Utah Business Magazine. The article explains how square footage is calculated helping giving you a few more tools when making commercial real estate investment decisions in Utah.

Misunderstandings regarding the method of calculating square footage in office buildings has been at the root of many disagreements between landlords and tenants.  This is especially true in smaller markets and with young companies who have been through the leasing process.

The full text article is included below or you can click the link to go to the website directly and read it. I hope you find it useful.

For Good Measure: Understanding how square footage is calculated in your lease 

One of the complexities tenants face when entering into an office lease involves understanding the measurement of their space for the purpose of calculating rent. While this might seem like a simple square-footage calculation, it’s usually anything but. In multi-tenant buildings, the number of square feet tenants “rent” is higher than the number of square feet they “use,” typically by as much as 7 to 20 percent.

Here I will explain the methodology behind different square footage calculations to help you make better-informed leasing decisions.

Useable square feet vs. rentable square feet

The useable square footage (USF) of an office suite is the space a tenant occupies. In most cases, this area is calculated as if interior walls and columns don’t exist. A tenant’s rentable square footage (RSF) is the USF plus a portion of the building’s shared or “common areas,” including lobbies, restrooms, hallways, telephone and electrical rooms, and perhaps shared conference rooms, workout facilities and showers. Landlords require tenants to pay for their proportionate share of common areas and therefore the monthly rent is always calculated on RSF.

The difference between the RSF and USF is referred to variously as the “load factor,” “loss factor,” “common area factor,” or “add-on factor.” Expressed as a ratio, a building’s load factor is calculated by dividing the RSF by the USF.

For example, a building measuring 200,000 square feet with 25,000 square feet of common area would contain 175,000 USF, and therefore have a load factor of 1.143. One could also say the building has a load factor of 14.3 percent.

When evaluating office space options, tenants should compare load factors. Landlords or their representatives should be able to provide these numbers. A lower factor is indicative of a more “efficient” building, giving the tenant more useable space for the rental dollar. However, if a more elaborate office environment with more spacious common areas is desired, a high load factor (as much as 20% or higher) could be acceptable.

Industry standards

Further complicating a tenant’s leasing decision is the fact that methods used by landlords to calculate USF and RSF can vary, making apples-to-apples comparisons difficult. In most U.S. cities, USF and RSF are calculated in accordance with standards established by the Building Owners and Managers Association (BOMA).

The lease proposals tenants request and the eventual lease agreements they sign should list both USF and RSF for the suite and the entire building, as well as specify that the BOMA standard has been used in calculating these measurements. I recommend that it be precisely spelled out as: “The Standard Method for Measuring Floor Area in Office Buildings published by the Building Owners and Managers Association International and approved by the American National Standards Institute, Inc., ANSI/BOMA Z65.1-2010.” Also acceptable is the “1996 BOMA Office Standard, ANSI/BOMA Z65.1-1996,” which is still used by many landlords.

To understand the slight variations between the two methods and determine which might be most advantageous in a given situation, tenants should consult a tenant-representative broker or a licensed architect.

Tenants should be very cautious about agreeing to methods of measurement other than the BOMA standard or any “modified” version of the BOMA standard. To do so allows the landlord full control over what is included or not included in the measurements.

Trust, but verify

Even when the BOMA standard is used, it is wise to have a tenant-representative broker or a licensed architect review the calculations and associated floor plans to ensure that BOMA standards have been properly applied to the characteristics of the building. It’s not uncommon to find “grey” areas where some negotiation is warranted. When dealing with a large office lease—or if there is doubt concerning the accuracy of measurements provided by the landlord—tenants should consider having an architect take it one step further by field-measuring the space before they sign a lease.

Tenants considering leasing commercial space outside the United States face extra complexity. The consistency and transparency offered by the BOMA standard do not exist in most countries. In 2014, an international group of organizations developed and implemented global standards for measuring real property—the International Property Measurement Standard (IPMS)—but it will take more time before this is implemented widely.

Sum it up

Most tenants, and even a good number of landlord representatives, don’t fully understand the intricacies of determining RSF, and yet variations can lead to large differences in the amount of rent tenants pay—as much as $100,000 over the five-year life of a 25,000 RSF lease. In this and all other aspects of commercial real estate leases, it pays to make the extra effort to understand exactly what you’re paying for and exactly what you’re getting in return.

The next time you sign a new lease or negotiate an extension to your current lease, consider retaining a tenant-representative broker who understands the complexities of commercial leases and can help you achieve the lowest costs and greatest benefits from your office space.

Mike Chappell is a senior advisor at Cresa Salt Lake City, where he specializes in office and industrial tenant representation.  For more information, visit cresa.com/saltlake. 


Read More

The Four Phases of the Commercial Real Estate Investment Cycle

September 12, 2016

I was recently reading an article written by Ian Formingle regarding the Four Phases of the Real Estate Cycle.  Whereas many are asking questions relative to where we are currently in the commercial real estate investment cycle I thought that I would share this.  The full text of article is below or you can click the link to go to the website directly and read it.

I was really impressed with the strategies he has shared regarding to investing at each phase of the cycle.  Many new investors perceive that you can only make money when the market is strong.

Please enjoy.

https://www.crowdstreet.com/education/article/four-phases-real-estate-cycle/

The Four Phases of the Real Estate Cycle

By Ian Formigle On July 15, 2016, 10:33 a.m., updated Sept. 2, 2016, 1:33 p.m.

Similar to the broader economy, commercial real estate is a cyclical market. There are four phases to the real estate cycle: Recovery, Expansion, Hypersupply and Recession. One of the unique aspects of real estate is that people can invest successfully across all four phases of the cycle. However, understanding whether a cycle is climbing closer to a market peak, or starting down the slippery slope towards a market low can often mean the difference between a successful investment and a significant loss. In this article we outline the four phases of the real estate market and provide strategies for successful investments at each stage.

Four Phases of the Real Estate Cycle

Similar to the broader economy, commercial real estate is a cyclical market. There are four phases to the real estate cycle:

  1. Recovery

  2. Expansion

  3. Hyper Supply

  4. Recession

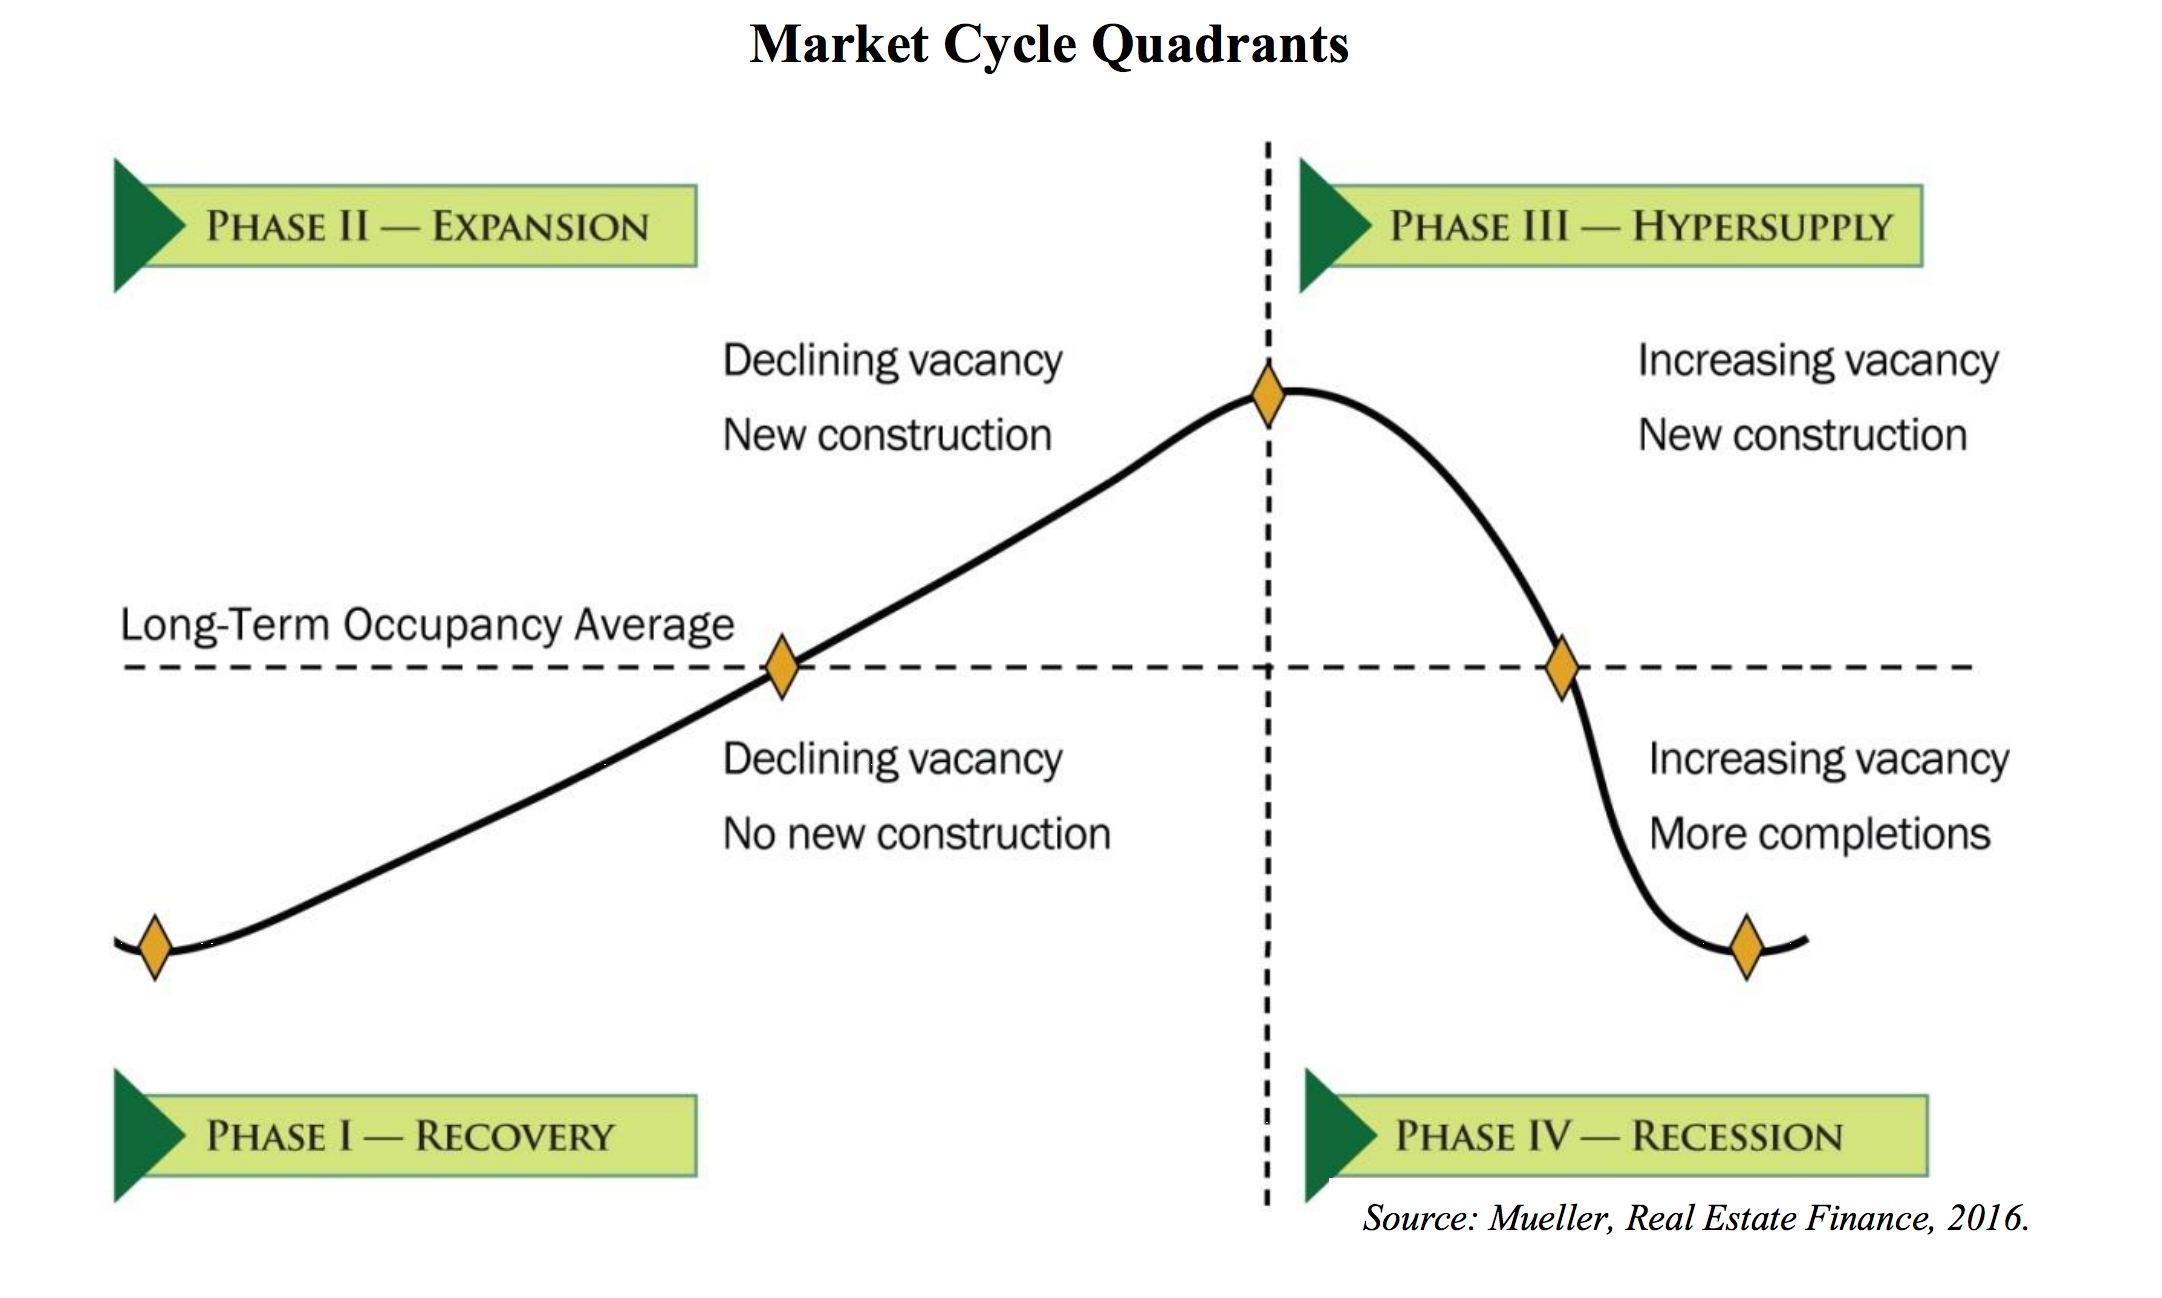
The four phases move in a continuous wave pattern that looks like this:


Image by Glenn R. Miller, PhD.

Depicted above is a single cycle. The end of the recession phase connects to the beginning of the recovery phase to form the continuous wave pattern.

As we begin, I want to give special thanks to our friend Dr. Glenn Mueller of the University of Denver for his thought leadership in this space. Any investor who wishes to do a deeper dive on real estate cycles is advised to check out Dr. Mueller’s outstanding work.

Understanding the progression of each phase within the cycle is critical in being able to identify investment opportunities, as well as risks that can arise, with heightened sensitivity when phases are on the verge of transitioning.

One of the unique aspects of commercial real estate is that investors can invest successfully across all four phases of the cycle. However, understanding whether a cycle is climbing closer to a market peak, or starting down the slippery slope towards a market low can affect a variety of factors, such as:

  • Pairing investment strategy to phase

  • Holding periods and exit strategies

  • Return expectations

  • Performance as it relates to income and appreciation

  • Timing of capital improvements

In this article, we describe each of the four phases and highlight certain appropriate investing strategies for each phase.

Phase 1: Recovery

The recovery phase is the bottom of the trough. Occupancies are likely at or near their low point with tepid demand for space and minimal leasing velocity. There is usually no new construction underway and rental rate growth is either still negative to flat or, later in the phase, possibly occurring, but at levels that are below the rate of inflation. Identifying the beginning of the recovery phase is difficult as the market still feels like it is in recession.

  • Strategies:

    • Opportunistic: Provided you move early in the phase, there are still opportunities to buy bargain-priced properties in varying states of distress and begin to reposition those assets as the recovery phase takes hold. Holding periods are often targeted at two to four years with a business plan that contemplates transitioning the subject acquisition out of its current state of distress and liquidating during the expansion phase once the property achieves a core-plus to value-add profile.

    • Value-add: Value-add strategies during a recovery phase require careful thought and patience. For example, while pricing may provide for a great basis in a value-add asset during the early to mid portion of a recovery phase, the business plan should include contingencies for execution since strong lease up may not occur until the early part of the expansion phase.

    • Core: Investing in core properties during the recovery phase can be a highly profitable strategy, particularly if the targeted asset has a significant amount of lease roll over the ensuing two to four years. A typical strategy for a core asset in a recovery phase will be to acquire a trophy asset in a “main and main” location and then capitalize on the strong rental growth of the next cycle through a combination of lease renewals and lease up of any residual vacancy from the previous recession phase. The asset is then primely positioned to be refinanced or sold during the expansion phase.

Phase 2: Expansion

During the expansion phase, the market is on the upswing in terms of growing demand for space. From a macroeconomic perspective, GDP growth is back to normal levels and quarterly job growth is strong. Occupancy rates are improving and rents are on the rise. Rents now approach levels that can justify new construction, and in certain very tight markets, surge ahead at breakneck speeds. Development activity begins to return during the expansion phase. There also is a high point during the expansion phase – the crest of the wave – where supply and demand is in equilibrium.

  • Strategies:

    • Development: This is the ideal time to develop or redevelop properties, because the current demand for space and leasing momentum helps properties stabilize more quickly upon delivery at rental rates that may set new market highs.

    • Core-Plus: Investors who seek lower levels of risk can acquire Core-Plus properties knowing they will enjoy high rates of tenant retention with continued rent growth.

    • Value-add: The expansion phase is prime time for value-add investing. Sophisticated investors can acquire properties with current deficiencies at substantial discounts to stabilized value, invest into capital expenditures and reposition assets rapidly aided by the strong absorption that is inherent to expansion phases of the cycle. Once repositioned, the asset can now command full stabilized value, which may translate into a refinance or sale.

    • Opportunistic: While most opportunistic opportunities have disappeared by the expansion phase, it may still be possible to find the exception case where a capital starved asset remains in a state of distress. In that event, an opportunistic strategy during an expansion phase can be highly profitable but should accompany a short holding period unless the business plan is to refinance and hold post stabilization.

Phase 3: Hypersupply

The equilibrium between supply and demand in the expansion wave often tips over into excess. Oversupply of space can be caused by overbuilding, or a pullback in demand caused by a shift in the economy. Hypersupply is marked by rising vacancies. Rent growth may remain positive, but at declining levels.

  • Strategies:

    • Core: Some investors may decide to sell assets ahead of they perceive as a coming decline in property values and more challenging leasing market. At the same time, other investors may concur on the macro perspective but instead of liquidity seek opportunities to take shelter from the coming storm. A core property with high occupancy and a rent roll chock full of credit tenants with average remaining lease terms in excess of five years is a prime example of a core property that will perform well through the downturn with lease roll that is optimally timed to occur during the next expansion phase.

    • Opportunistic: At this phase in cycle, an opportunistic strategy may be more of a pricing strategy that can apply to any asset class rather than a typical distressed asset scenario. For example, once the hypersupply phase has set in, owners who are ill-equipped to operate through the impending recession, may hit the panic button and liquidate assets at prices that end up approaching recession price levels. In this scenario, the buyer leverages its capital superiority position to acquire a solid asset that he/she is confident will ultimately perform well in the next cycle with a recession phase already priced into the deal.

Phase 4: Recession

Supply outweighs demand, which produces higher vacancies. Rent growth during recession is either negative or at levels that are below the rate of inflation. In addition, operators often resort to offering more concessions and rent reductions to entice and retain tenants.

  • Strategies:

    • Opportunistic: This is an ideal time buy distressed assets at steep discounts to replacement cost. It is during the recession phase that buyers will also have the highest probability of acquiring assets in distressed scenarios such as special servicers and lender foreclosures, which are commonly referred to as real estate owned or “REOs”. This strategy focuses on absolute basis with a patient and well-capitalized business plan that, when the recovery phase emerges and the sun begins to shine again, the acquirer will then commence repositioning the asset with hopes of disposing of it during the end of the recovery phase or early expansion phase.

Once you understand the four phases of the cycle it then becomes important to begin grasping variances of the four phases.

First, phases do not necessarily occur in equal periods. The recovery phase may be brief and quickly transition to the expansion phase, or it may drag on for years. It’s also difficult to project the duration of expansion phases. In addition, cycles can have different total duration. Just because there was general consensus that a previous cycle was nine years doesn’t mean that the next cycle will approximate the same total duration.

Second, cycles vary depending on geography and asset class. Certain markets, such as gateway markets, may lead the transition from recession to recovery phases of the next cycle with secondary and tertiary markets to follow suit. Also, different asset classes recover, expand, oversupply and decline at different rates with some of the rate variance attributable to the asset class itself and some of the variance attributable to location both at the metro level and within metros. For example, while overall, the office asset class may be in an expansion phase in a given market, suburban office assets may still be in recovery while urban office may be nearing hypersupply. Therefore, when applying the concept of the four phases of the real estate cycle to a specific asset you must also overlay geographic location and asset class to truly gain a sense of where that asset plots along the cycle wave.

The differences that exist between market timing and performance at different stages of the real estate cycle speak to the importance of creating a diverse real estate investment portfolio to balance out the highs and lows in performance. To that point, CrowdStreet aims to provide a wide variety of real estate investment opportunities across property types and geographic markets.

Read More