The Northwood Group

Building Partner Investors

Commercial Real Estate


Understanding How Office Building Square Footage is Calculated in Utah Commercial Real Estate

September 21, 2016

I recently read an article written by Mike Chappell in the September 9th issue of Utah Business Magazine. The article explains how square footage is calculated helping giving you a few more tools when making commercial real estate investment decisions in Utah.

Misunderstandings regarding the method of calculating square footage in office buildings has been at the root of many disagreements between landlords and tenants.  This is especially true in smaller markets and with young companies who have been through the leasing process.

The full text article is included below or you can click the link to go to the website directly and read it. I hope you find it useful.

For Good Measure: Understanding how square footage is calculated in your lease 

One of the complexities tenants face when entering into an office lease involves understanding the measurement of their space for the purpose of calculating rent. While this might seem like a simple square-footage calculation, it’s usually anything but. In multi-tenant buildings, the number of square feet tenants “rent” is higher than the number of square feet they “use,” typically by as much as 7 to 20 percent.

Here I will explain the methodology behind different square footage calculations to help you make better-informed leasing decisions.

Useable square feet vs. rentable square feet

The useable square footage (USF) of an office suite is the space a tenant occupies. In most cases, this area is calculated as if interior walls and columns don’t exist. A tenant’s rentable square footage (RSF) is the USF plus a portion of the building’s shared or “common areas,” including lobbies, restrooms, hallways, telephone and electrical rooms, and perhaps shared conference rooms, workout facilities and showers. Landlords require tenants to pay for their proportionate share of common areas and therefore the monthly rent is always calculated on RSF.

The difference between the RSF and USF is referred to variously as the “load factor,” “loss factor,” “common area factor,” or “add-on factor.” Expressed as a ratio, a building’s load factor is calculated by dividing the RSF by the USF.

For example, a building measuring 200,000 square feet with 25,000 square feet of common area would contain 175,000 USF, and therefore have a load factor of 1.143. One could also say the building has a load factor of 14.3 percent.

When evaluating office space options, tenants should compare load factors. Landlords or their representatives should be able to provide these numbers. A lower factor is indicative of a more “efficient” building, giving the tenant more useable space for the rental dollar. However, if a more elaborate office environment with more spacious common areas is desired, a high load factor (as much as 20% or higher) could be acceptable.

Industry standards

Further complicating a tenant’s leasing decision is the fact that methods used by landlords to calculate USF and RSF can vary, making apples-to-apples comparisons difficult. In most U.S. cities, USF and RSF are calculated in accordance with standards established by the Building Owners and Managers Association (BOMA).

The lease proposals tenants request and the eventual lease agreements they sign should list both USF and RSF for the suite and the entire building, as well as specify that the BOMA standard has been used in calculating these measurements. I recommend that it be precisely spelled out as: “The Standard Method for Measuring Floor Area in Office Buildings published by the Building Owners and Managers Association International and approved by the American National Standards Institute, Inc., ANSI/BOMA Z65.1-2010.” Also acceptable is the “1996 BOMA Office Standard, ANSI/BOMA Z65.1-1996,” which is still used by many landlords.

To understand the slight variations between the two methods and determine which might be most advantageous in a given situation, tenants should consult a tenant-representative broker or a licensed architect.

Tenants should be very cautious about agreeing to methods of measurement other than the BOMA standard or any “modified” version of the BOMA standard. To do so allows the landlord full control over what is included or not included in the measurements.

Trust, but verify

Even when the BOMA standard is used, it is wise to have a tenant-representative broker or a licensed architect review the calculations and associated floor plans to ensure that BOMA standards have been properly applied to the characteristics of the building. It’s not uncommon to find “grey” areas where some negotiation is warranted. When dealing with a large office lease—or if there is doubt concerning the accuracy of measurements provided by the landlord—tenants should consider having an architect take it one step further by field-measuring the space before they sign a lease.

Tenants considering leasing commercial space outside the United States face extra complexity. The consistency and transparency offered by the BOMA standard do not exist in most countries. In 2014, an international group of organizations developed and implemented global standards for measuring real property—the International Property Measurement Standard (IPMS)—but it will take more time before this is implemented widely.

Sum it up

Most tenants, and even a good number of landlord representatives, don’t fully understand the intricacies of determining RSF, and yet variations can lead to large differences in the amount of rent tenants pay—as much as $100,000 over the five-year life of a 25,000 RSF lease. In this and all other aspects of commercial real estate leases, it pays to make the extra effort to understand exactly what you’re paying for and exactly what you’re getting in return.

The next time you sign a new lease or negotiate an extension to your current lease, consider retaining a tenant-representative broker who understands the complexities of commercial leases and can help you achieve the lowest costs and greatest benefits from your office space.

Mike Chappell is a senior advisor at Cresa Salt Lake City, where he specializes in office and industrial tenant representation.  For more information, visit cresa.com/saltlake. 


Read More

The Four Phases of the Commercial Real Estate Investment Cycle

September 12, 2016

I was recently reading an article written by Ian Formingle regarding the Four Phases of the Real Estate Cycle.  Whereas many are asking questions relative to where we are currently in the commercial real estate investment cycle I thought that I would share this.  The full text of article is below or you can click the link to go to the website directly and read it.

I was really impressed with the strategies he has shared regarding to investing at each phase of the cycle.  Many new investors perceive that you can only make money when the market is strong.

Please enjoy.

https://www.crowdstreet.com/education/article/four-phases-real-estate-cycle/

The Four Phases of the Real Estate Cycle

By Ian Formigle On July 15, 2016, 10:33 a.m., updated Sept. 2, 2016, 1:33 p.m.

Similar to the broader economy, commercial real estate is a cyclical market. There are four phases to the real estate cycle: Recovery, Expansion, Hypersupply and Recession. One of the unique aspects of real estate is that people can invest successfully across all four phases of the cycle. However, understanding whether a cycle is climbing closer to a market peak, or starting down the slippery slope towards a market low can often mean the difference between a successful investment and a significant loss. In this article we outline the four phases of the real estate market and provide strategies for successful investments at each stage.

Four Phases of the Real Estate Cycle

Similar to the broader economy, commercial real estate is a cyclical market. There are four phases to the real estate cycle:

  1. Recovery

  2. Expansion

  3. Hyper Supply

  4. Recession

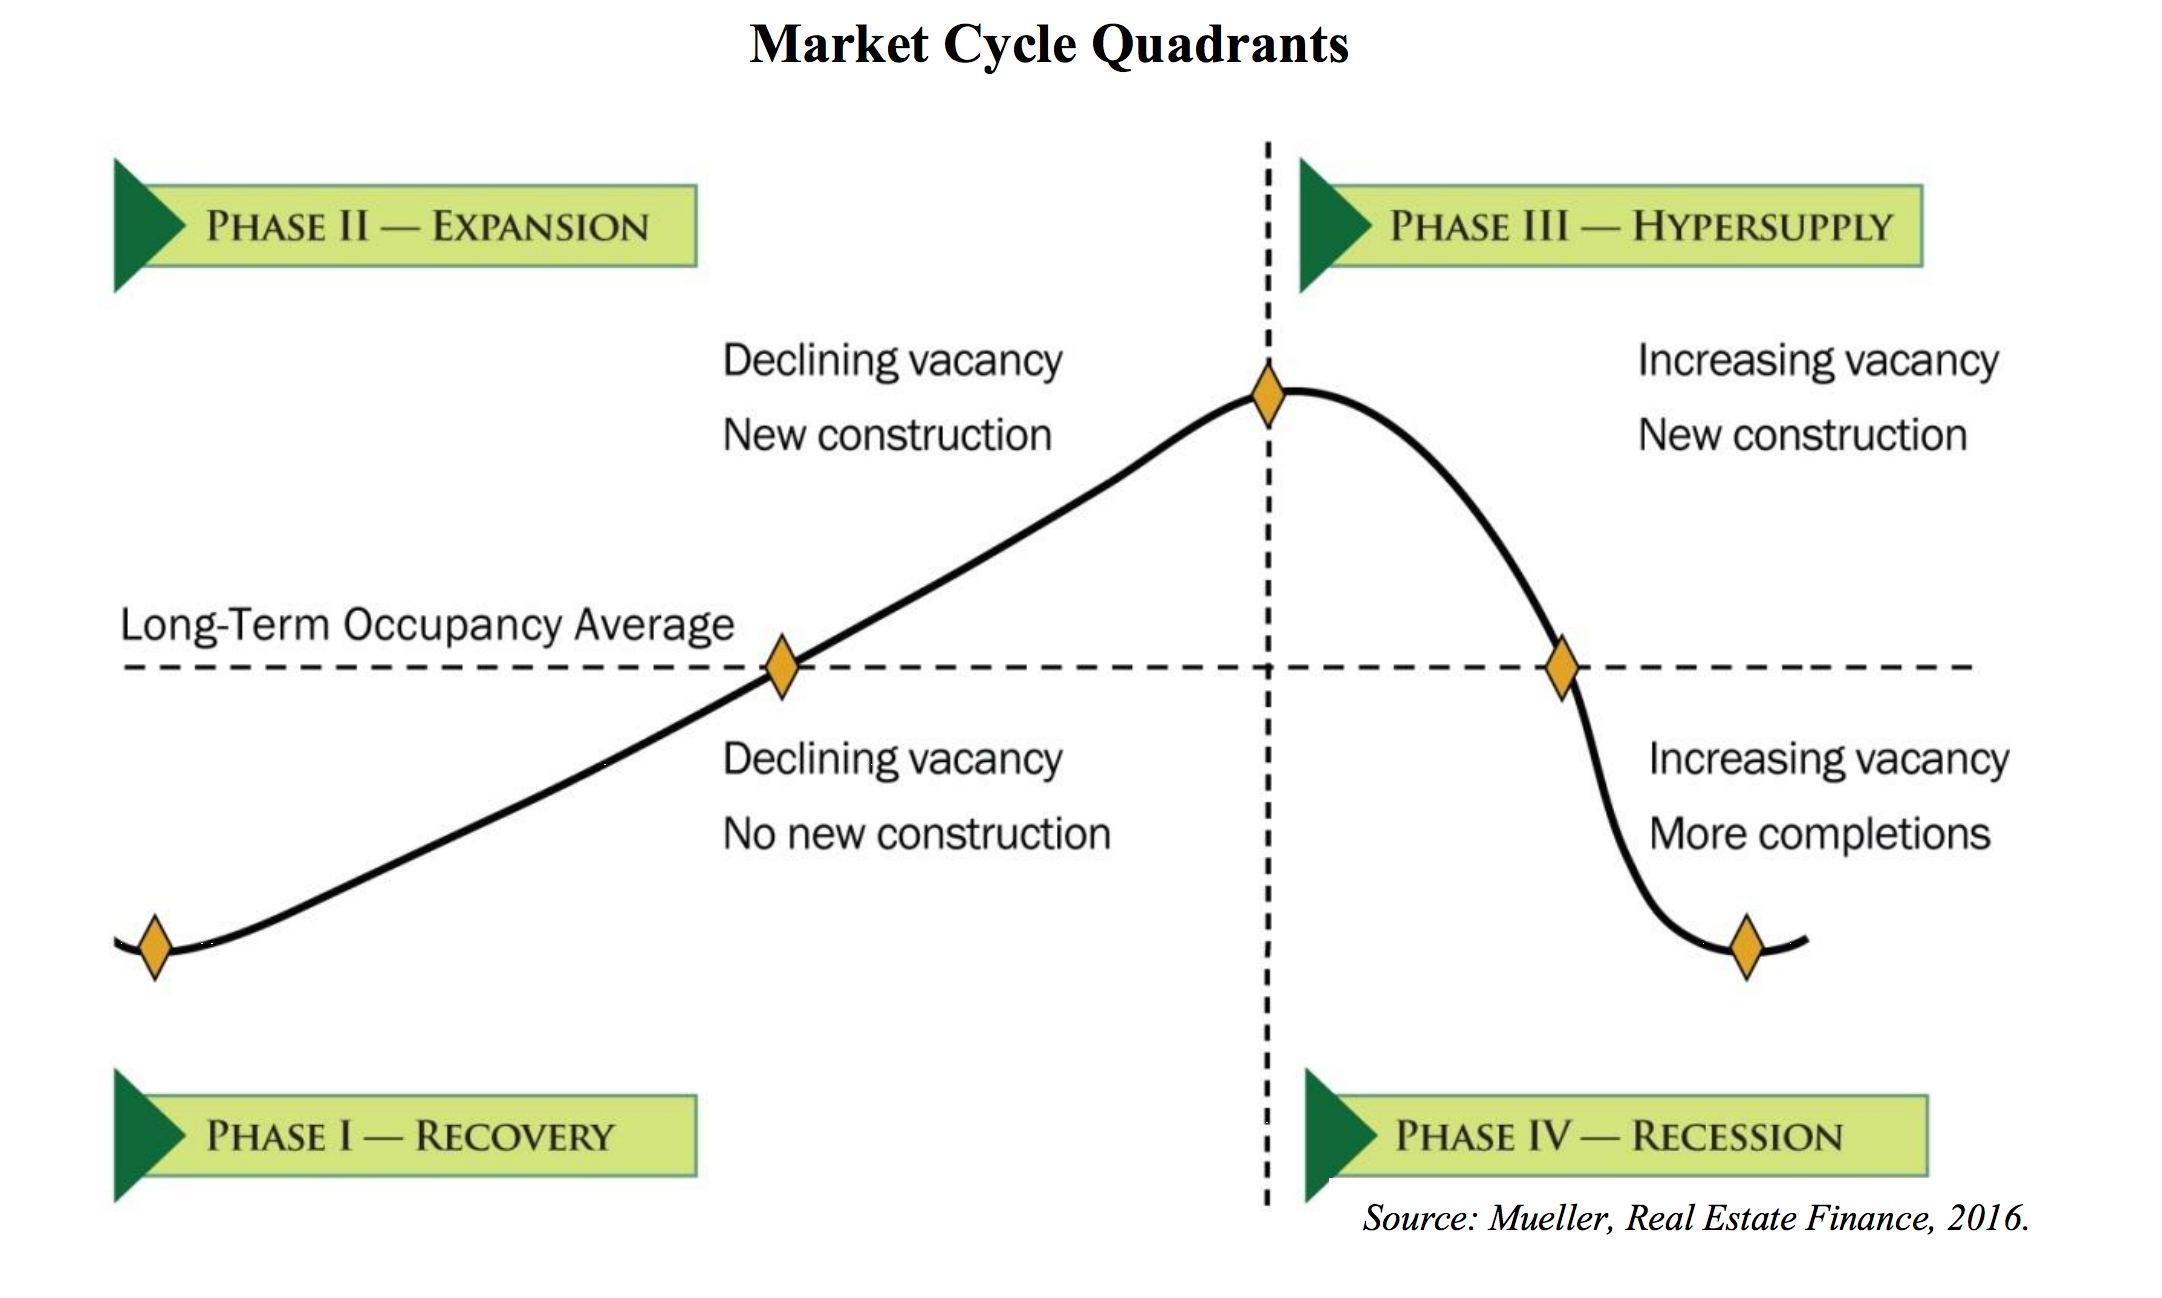
The four phases move in a continuous wave pattern that looks like this:


Image by Glenn R. Miller, PhD.

Depicted above is a single cycle. The end of the recession phase connects to the beginning of the recovery phase to form the continuous wave pattern.

As we begin, I want to give special thanks to our friend Dr. Glenn Mueller of the University of Denver for his thought leadership in this space. Any investor who wishes to do a deeper dive on real estate cycles is advised to check out Dr. Mueller’s outstanding work.

Understanding the progression of each phase within the cycle is critical in being able to identify investment opportunities, as well as risks that can arise, with heightened sensitivity when phases are on the verge of transitioning.

One of the unique aspects of commercial real estate is that investors can invest successfully across all four phases of the cycle. However, understanding whether a cycle is climbing closer to a market peak, or starting down the slippery slope towards a market low can affect a variety of factors, such as:

  • Pairing investment strategy to phase

  • Holding periods and exit strategies

  • Return expectations

  • Performance as it relates to income and appreciation

  • Timing of capital improvements

In this article, we describe each of the four phases and highlight certain appropriate investing strategies for each phase.

Phase 1: Recovery

The recovery phase is the bottom of the trough. Occupancies are likely at or near their low point with tepid demand for space and minimal leasing velocity. There is usually no new construction underway and rental rate growth is either still negative to flat or, later in the phase, possibly occurring, but at levels that are below the rate of inflation. Identifying the beginning of the recovery phase is difficult as the market still feels like it is in recession.

  • Strategies:

    • Opportunistic: Provided you move early in the phase, there are still opportunities to buy bargain-priced properties in varying states of distress and begin to reposition those assets as the recovery phase takes hold. Holding periods are often targeted at two to four years with a business plan that contemplates transitioning the subject acquisition out of its current state of distress and liquidating during the expansion phase once the property achieves a core-plus to value-add profile.

    • Value-add: Value-add strategies during a recovery phase require careful thought and patience. For example, while pricing may provide for a great basis in a value-add asset during the early to mid portion of a recovery phase, the business plan should include contingencies for execution since strong lease up may not occur until the early part of the expansion phase.

    • Core: Investing in core properties during the recovery phase can be a highly profitable strategy, particularly if the targeted asset has a significant amount of lease roll over the ensuing two to four years. A typical strategy for a core asset in a recovery phase will be to acquire a trophy asset in a “main and main” location and then capitalize on the strong rental growth of the next cycle through a combination of lease renewals and lease up of any residual vacancy from the previous recession phase. The asset is then primely positioned to be refinanced or sold during the expansion phase.

Phase 2: Expansion

During the expansion phase, the market is on the upswing in terms of growing demand for space. From a macroeconomic perspective, GDP growth is back to normal levels and quarterly job growth is strong. Occupancy rates are improving and rents are on the rise. Rents now approach levels that can justify new construction, and in certain very tight markets, surge ahead at breakneck speeds. Development activity begins to return during the expansion phase. There also is a high point during the expansion phase – the crest of the wave – where supply and demand is in equilibrium.

  • Strategies:

    • Development: This is the ideal time to develop or redevelop properties, because the current demand for space and leasing momentum helps properties stabilize more quickly upon delivery at rental rates that may set new market highs.

    • Core-Plus: Investors who seek lower levels of risk can acquire Core-Plus properties knowing they will enjoy high rates of tenant retention with continued rent growth.

    • Value-add: The expansion phase is prime time for value-add investing. Sophisticated investors can acquire properties with current deficiencies at substantial discounts to stabilized value, invest into capital expenditures and reposition assets rapidly aided by the strong absorption that is inherent to expansion phases of the cycle. Once repositioned, the asset can now command full stabilized value, which may translate into a refinance or sale.

    • Opportunistic: While most opportunistic opportunities have disappeared by the expansion phase, it may still be possible to find the exception case where a capital starved asset remains in a state of distress. In that event, an opportunistic strategy during an expansion phase can be highly profitable but should accompany a short holding period unless the business plan is to refinance and hold post stabilization.

Phase 3: Hypersupply

The equilibrium between supply and demand in the expansion wave often tips over into excess. Oversupply of space can be caused by overbuilding, or a pullback in demand caused by a shift in the economy. Hypersupply is marked by rising vacancies. Rent growth may remain positive, but at declining levels.

  • Strategies:

    • Core: Some investors may decide to sell assets ahead of they perceive as a coming decline in property values and more challenging leasing market. At the same time, other investors may concur on the macro perspective but instead of liquidity seek opportunities to take shelter from the coming storm. A core property with high occupancy and a rent roll chock full of credit tenants with average remaining lease terms in excess of five years is a prime example of a core property that will perform well through the downturn with lease roll that is optimally timed to occur during the next expansion phase.

    • Opportunistic: At this phase in cycle, an opportunistic strategy may be more of a pricing strategy that can apply to any asset class rather than a typical distressed asset scenario. For example, once the hypersupply phase has set in, owners who are ill-equipped to operate through the impending recession, may hit the panic button and liquidate assets at prices that end up approaching recession price levels. In this scenario, the buyer leverages its capital superiority position to acquire a solid asset that he/she is confident will ultimately perform well in the next cycle with a recession phase already priced into the deal.

Phase 4: Recession

Supply outweighs demand, which produces higher vacancies. Rent growth during recession is either negative or at levels that are below the rate of inflation. In addition, operators often resort to offering more concessions and rent reductions to entice and retain tenants.

  • Strategies:

    • Opportunistic: This is an ideal time buy distressed assets at steep discounts to replacement cost. It is during the recession phase that buyers will also have the highest probability of acquiring assets in distressed scenarios such as special servicers and lender foreclosures, which are commonly referred to as real estate owned or “REOs”. This strategy focuses on absolute basis with a patient and well-capitalized business plan that, when the recovery phase emerges and the sun begins to shine again, the acquirer will then commence repositioning the asset with hopes of disposing of it during the end of the recovery phase or early expansion phase.

Once you understand the four phases of the cycle it then becomes important to begin grasping variances of the four phases.

First, phases do not necessarily occur in equal periods. The recovery phase may be brief and quickly transition to the expansion phase, or it may drag on for years. It’s also difficult to project the duration of expansion phases. In addition, cycles can have different total duration. Just because there was general consensus that a previous cycle was nine years doesn’t mean that the next cycle will approximate the same total duration.

Second, cycles vary depending on geography and asset class. Certain markets, such as gateway markets, may lead the transition from recession to recovery phases of the next cycle with secondary and tertiary markets to follow suit. Also, different asset classes recover, expand, oversupply and decline at different rates with some of the rate variance attributable to the asset class itself and some of the variance attributable to location both at the metro level and within metros. For example, while overall, the office asset class may be in an expansion phase in a given market, suburban office assets may still be in recovery while urban office may be nearing hypersupply. Therefore, when applying the concept of the four phases of the real estate cycle to a specific asset you must also overlay geographic location and asset class to truly gain a sense of where that asset plots along the cycle wave.

The differences that exist between market timing and performance at different stages of the real estate cycle speak to the importance of creating a diverse real estate investment portfolio to balance out the highs and lows in performance. To that point, CrowdStreet aims to provide a wide variety of real estate investment opportunities across property types and geographic markets.

Read More

Just Sold – Woodland Park

September 12, 2016

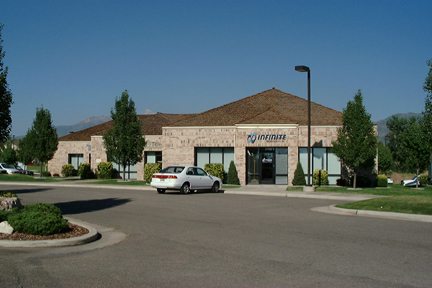
We are pleased to announce the sale of one of the Woodland Park office buildings located at 1572 North Woodland Park Drive in Layton, Utah. The building is approximately 7,635 square feet and is part of a 6 building office complex.  More information regarding this sale is available upon request.

Read More

Just Sold – Rachel Plaza

August 25, 2016

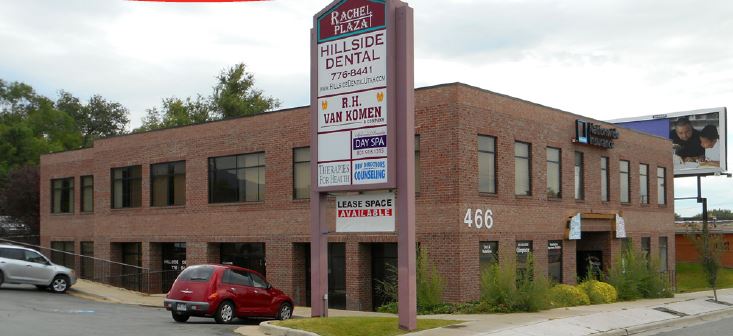
We are pleased to announce the sale of the Rachel Plaza located at 466 North Main Street in Clearfield, Utah.  The building was acquired by a local medical professional who will occupy a portion of the building.  The building is approximately 12,000 square feet on two levels.  More information regarding this sale is available upon request.

Read More

Just Sold – Executive Office Building

August 25, 2016

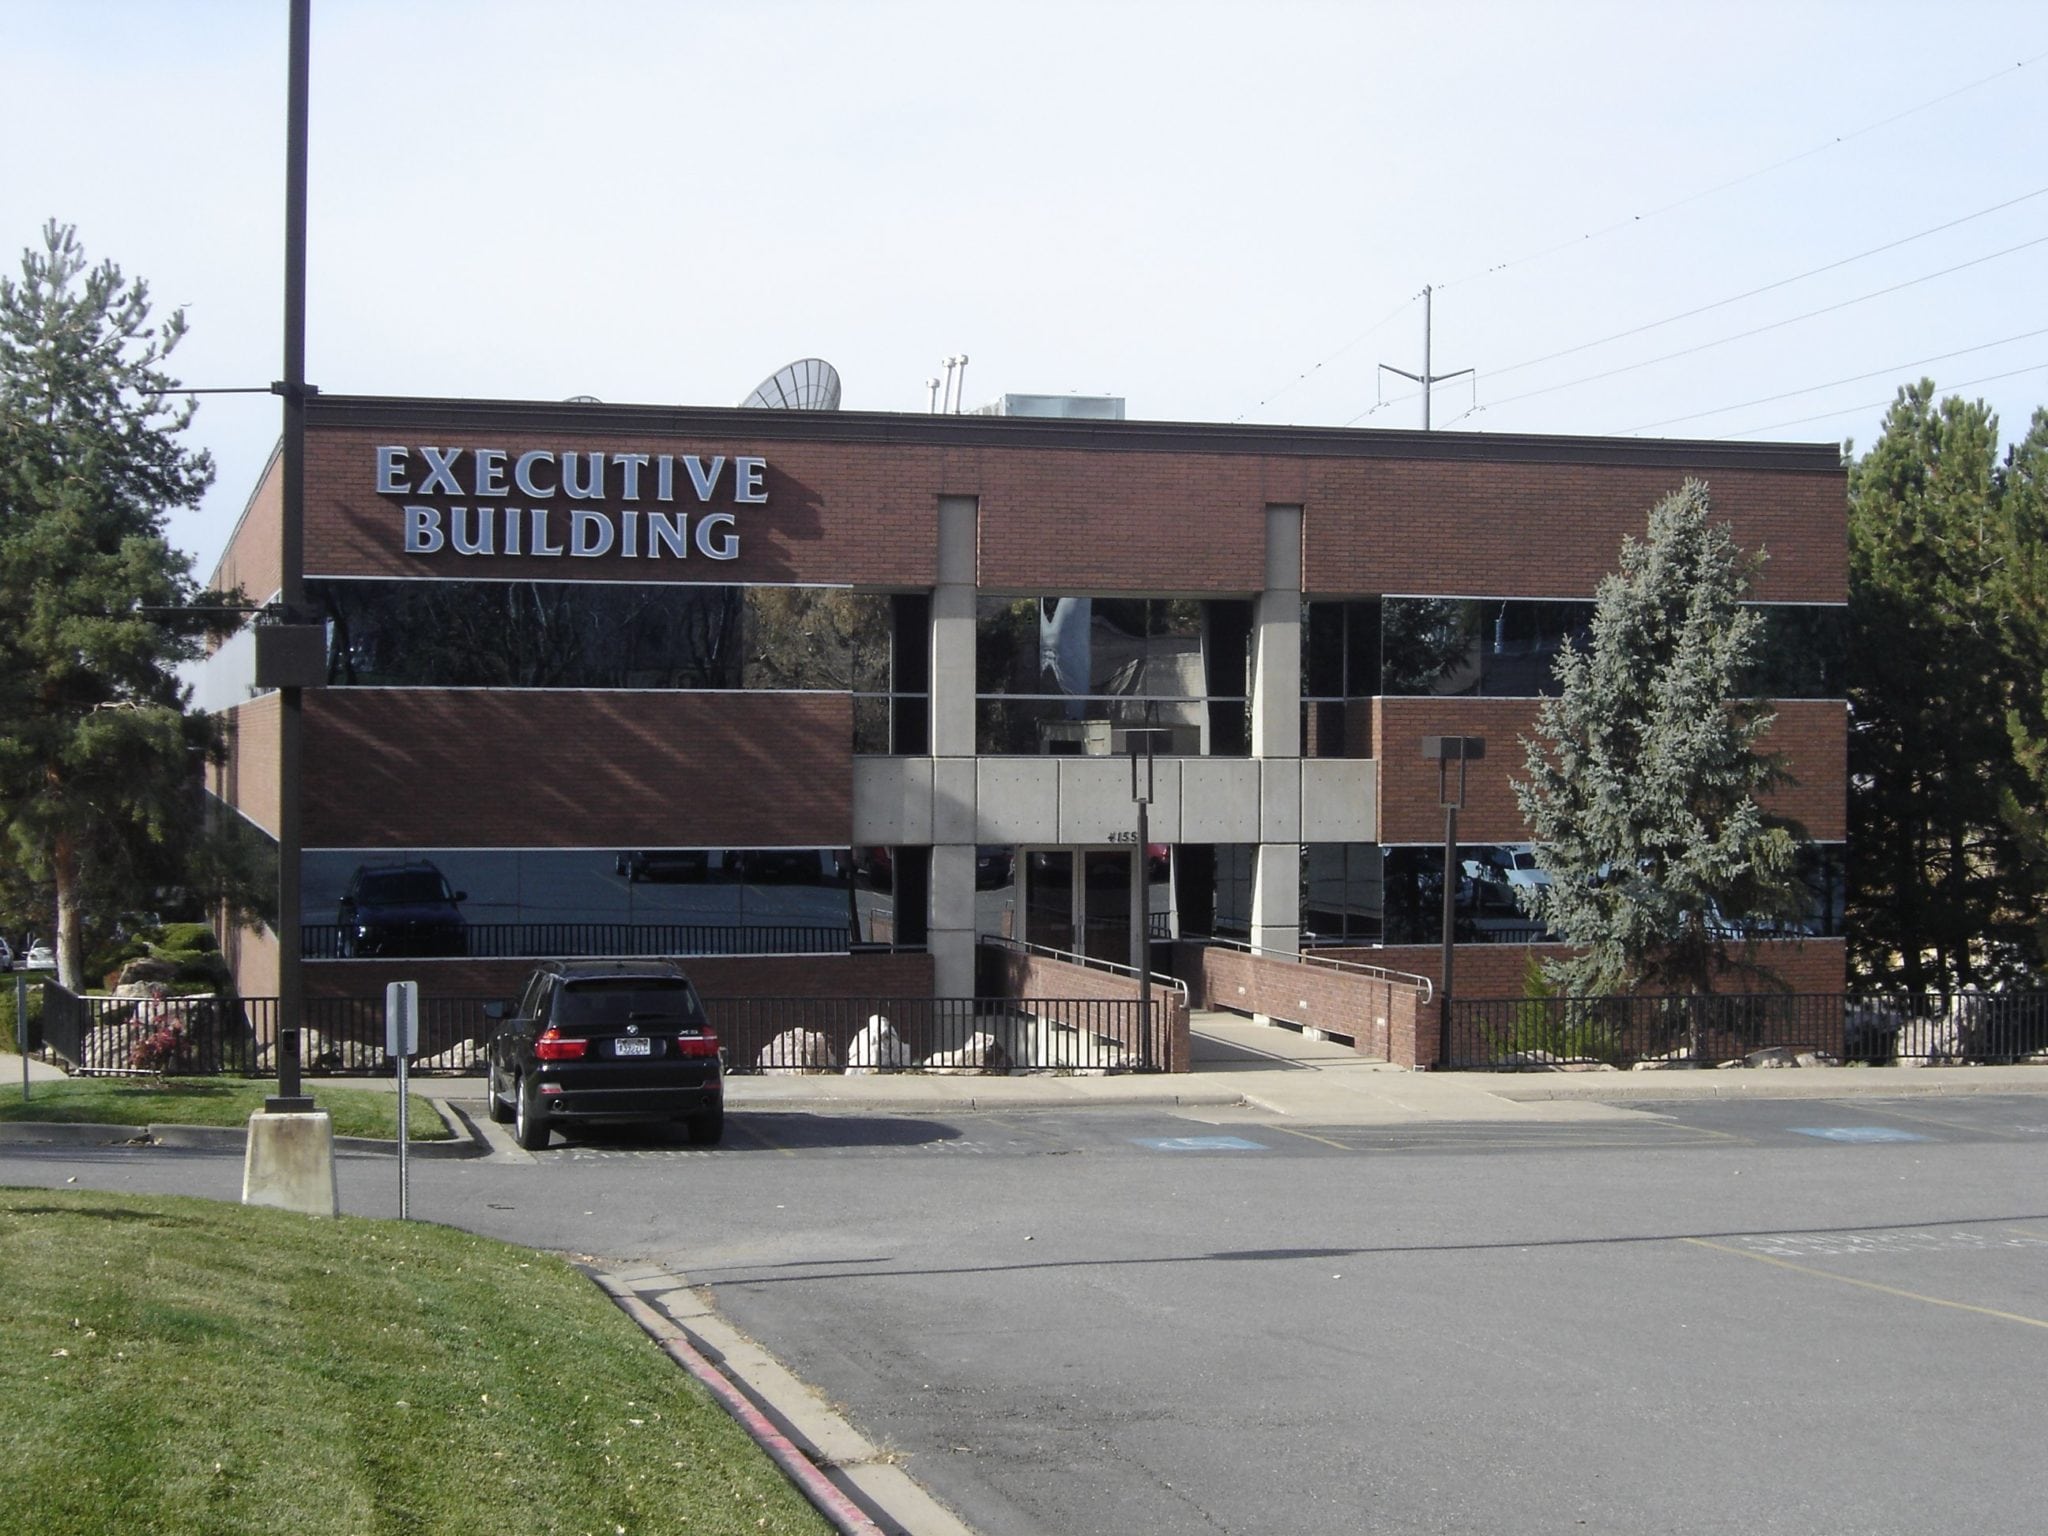
We are pleased to announce the sale of the Executive Office Building located at 4155 South Harrison Boulevard in Ogden, Utah.  The building was acquired by a regional security company in its continued expansion efforts.  The building is just over 40,000 square feet on three levels and is part of a four building office park.  More information on this sale is available upon request.

Read More

Top Ten Commercial Real Estate Issues

August 18, 2016

Utah Commercial Real Estate

I was recently reading an article published by The CRE (The Counselors of Real Estate) organization titled The CRE 2016-17 Top Ten Issues Affecting Real Estate.  I have great respect for the CRE organization and find their reports very well researched and have delineated how this affects Utah commercial real estate.

The CRE® 2016-17 Top Ten Issues Affecting Real Estate

After reading the article I wanted to add a few bullets related directly to the Utah Commercial Real Estate Investment Market.  First I will share their list.  Explanations of their top 10 are included in the link to their article above.

  1. The Changing Global Economy
  2. Debt Capital Market Retrenchment
  3. Demographic Shifts
  4. Densification/Urbanization
  5. The Political Environment
  6. Housing Affordability and Credit Constraints
  7. The Disappearing Middle Class
  8. Energy
  9. The Sharing/Virtual Economy
  10. The Rise of Experiential Retail

With those in mind, let me add a few thoughts specifically related to the Utah Commercial Real Estate Investment Market:

  1. Water:  With the population along the Wasatch Front expected to double over the next 30 to 40 years water is going to become a big issue.  Not only does the water supply need to increase but much of the existing infrastructure is aging and in need of replacement.  Residents also need to become more “water conscious”.  Fortunately, solutions exist and the water districts are working with elected officials to address the costs of these projects well ahead of the need.
  2. Utah’s Unique Geography:  The Wasatch Front is unique in that it is bounded by mountains on the east and the Great Salt Lake on the West limiting the amount of developable ground.   In Salt Lake County and surrounding areas there is very little land for growth.  This is good news for existing property owners as demand has led to increased values and repurposing of existing buildings.  It has also been good news for Davis  and Utah Counties which have seen strong job growth as companies have located closer to talent.
  3. Suburban Cities and Their Views on Land Use:  With the changing demographic shifts described in the CRE article, suburban cities have had to re-look at how they view land use.  In place of large lot single family development cities have increasingly looked at higher density residential and mixed use projects especially around their downtown areas.  This has really helped the commercial development in these areas.
  4. Lease Rates Relative to Construction Costs:  As I have looked at historical lease rate trends I have been really interested by what I’ve found relative to Class B office lease rates.  Lease rates have been almost flat for the past 15 years.  There have been points where they have increased just prior to a recession but lease rates today are very similar to what they were 15 years ago.  Meanwhile construction costs have continued to steadily increase.  With the current low vacancy rates I believe that there is pent up lease rate growth in these properties.  New Class A projects have been successful at significantly higher lease rates.  Demand appears to be outpacing new office development which should bode well for existing office owners.

These are just a few of the issues facing commercial real estate investment in Utah and the market in general.  I would love your input on the issues that you feel are relevant.  As always, feel free to reach out to discuss.

Read More

Construction Cost Updates – Q1 2016

March 7, 2016

Commercial Real Estate Broker Utah

We are grateful for Bonneville Builders regularly supplying us with updates on construction costs in the commercial real estate Utah market.  As the commercial real estate investment market continues to heat-up prices tend to inflate as they relate to the underlying construction costs.  These estimates provide a good basis for comparison.  The link to the report is below.

Ball Park Estimates Q1 – 2016

A few items on the report that I found interesting and noteworthy:

  • The increasing cost of tenant improvements in the office world.  Oftentimes I see too low of assumptions on re-tenanting office buildings.
  • Small industrial buildings range from $65 to $67 per square foot.  Lease rates have not kept up with construction costs and it is very difficult to develop this type of product.  Good news for those already owning this product type.

Hopefully this information is helpful.  Please feel free to reach out to Bonneville Builders direction for questions on the data provided.  They can be reached at 801-263-1406 or JohnT@bonnevillebuilders.com (www.bonnevillebuilders.com)

Read More

2015 Investment Market Re-Cap

March 1, 2016

Commercial Real Estate

At the end of every year as a commercial real estate investment broker you take some time to review the previous year and make certain observations.  You also look at previous years to see if there are any notable trends compared to other times.  All of us want a crystal ball and everybody has an opinion regarding what is happening in the market.  I will provide my own thoughts in the coming weeks but I recently received a video from Bryce Blanchard, one of my friends and colleagues in the commercial real estate world.  I found his presentation very insightful and entertaining.  I thought you might enjoy it.  The link to his video is below.

2015 YEAR END INVESTMENT REPORT – Bryce Blanchard – Newmark Grubb Acres

Read More

Just Sold – North Street Apartments

February 22, 2016

Single Tenant Properties Utah

We are pleased to announce the sale of the North Street Apartments in Kaysville, Utah.  The North Street Apartments are a 14 unit project in Kaysville City’s downtown area.  It is one of very few multi-family projects in the city.

Additional information on the sale available upon request.

Read More

Just Sold – SLC Multi-Family Land

December 15, 2015

Commercial Real Estate Salt Lake City

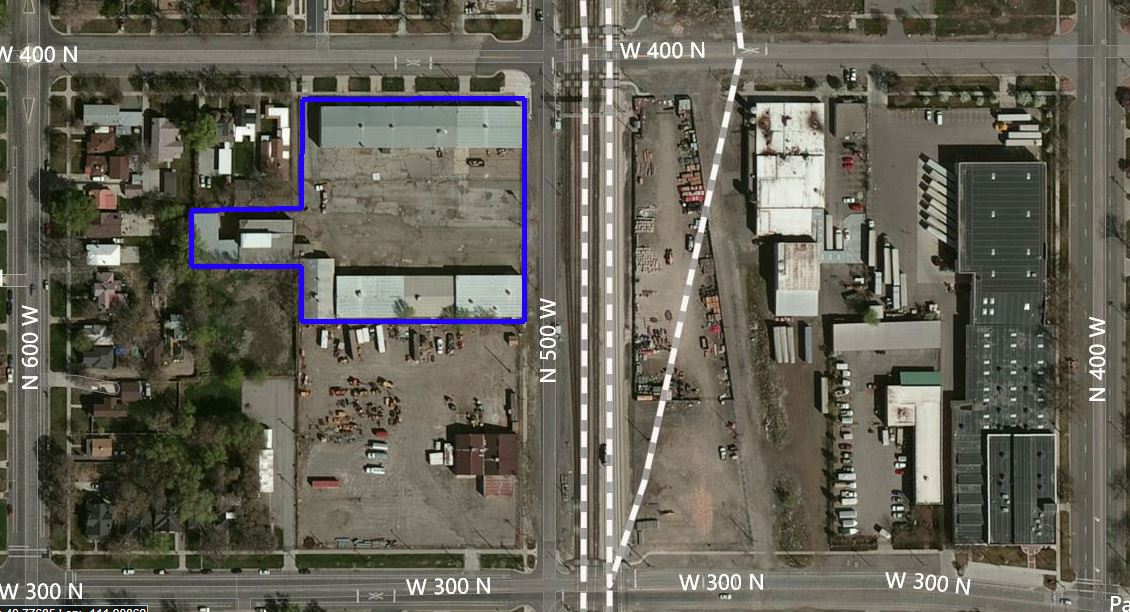
We are pleased to announce the sale of 2.83 acres of multi-family development land in Salt Lake City, Utah.  The property is currently used as an industrial park and falls within Salt Lake City’s Transit Station zone allowing high density multi-family re-development.  The site’s proximity to the North Temple Front Runner Station and the TRAX North Temple Bridge make it an attractive re-development site for commercial real estate salt lake city.

Additional details of the sale available upon request.


Read More